The VV Index.
Ballon d’Or seasons the Index puts in its top three bands.
It has never seen an award. No honour, team or individual, adds a single point to a VV Score. They land there anyway, and 10 of the fourteen reach 90.
3 of them sit inside the twelve highest-scoring seasons in the entire record, and nothing was tuned to put them there.
70The score the Index gives Luka Modric’s 2017/18, the one Ballon d’Or season it misses. That award leaned on a third straight Champions League, which the Index refuses to count, and deep midfielders are the shape it reads least well: it counts the pass completed, not the position that made it possible. One of those is a choice. The other is a limit.
How a season becomes a number
54,416 seasons have been through exactly that, on the same basis , which is why a 2011 season and a 2025 one can be set against each other at all. Minutes, output, position, league, and nothing else , not even the five dimensions drawn on a player’s card. That radar is a second reading of the same season, shown beside the score, never inside it.
Four tiers, not nine places
Each league's weight is measured from players who moved between two of our nine leagues in consecutive seasons, with at least 900 minutes on each side, and how their goals and assists per 90 changed when they did. The Premier League is the reference at 1.00. The weight is softened before it touches a season: it trims the base figure the score is read from, by the percentage in the table. Near the top the score ladder is compressed, so the final number moves by less than that. A defender's attacking bonus is scaled by the weight more steeply.
The tiers are separate: each gap between them held in at least 96 of 100 resamples. Inside a tier the order is not, which is why each tier is listed alphabetically. The engine uses a weight for each season, built from the five seasons around it; this table shows each league across the whole record.
| League | Weight | Likely rangeRange | Trim to the base figureTrim | Tier |
|---|---|---|---|---|
| Premier League | 1.00 | the reference | 0% | 1 |
| La Liga | 0.88 | 0.80 to 1.00 | 4% | 2 |
| Serie A | 0.88 | 0.82 to 0.99 | 4% | |
| Bundesliga | 0.79 | 0.73 to 0.90 | 7% | 3 |
| Ligue 1 | 0.77 | 0.70 to 0.85 | 8% | |
| Belgian Pro League | 0.60 | 0.55 to 0.71 | 14% | 4 |
| Eredivisie | 0.63 | 0.56 to 0.72 | 13% | |
| Primeira Liga | 0.58 | 0.51 to 0.68 | 15% | |
| Süper Lig | 0.64 | 0.58 to 0.73 | 13% |
What it cannot see
- Measured through attacking output. A move shows up in goals and assists, so that is what we measure. Defenders and goalkeepers carry weights learned from attackers.
- A move is more than a change of league. A player who joins a bigger club gets better teammates and more of the ball, and nothing here can tell that apart from the league itself.
- Movers are not a random sample. Clubs buy players after good seasons, and some of that form fades whatever league they join. Taking medians and counting moves in both directions reduces this. It does not remove it.
- Only moves between our nine leagues count. 991 on the latest count, from 135 touching Belgium to 323 touching the Premier League.
- One setting is judgement. High-scoring leagues inflate everyone's output, so each league's scoring rate is partly corrected for. How much, a factor of 0.5, was chosen by comparing alternatives, not measured.
- It is relative. It says how the leagues compare with each other, not whether football as a whole got stronger.
- It was built once, in July 2026, and has not been recomputed since. The current season uses each league's long-run value. Rebuilt on today's data, no weight moved by more than 0.06.
What it will not tell you
Some of these the Index cannot do. Some it will not. Every one is on the card it affects.
League titles, Champions Leagues, Ballons d’Or, Golden Boots. Not one moves a score by a point.
The score is finished before the vote happens. Honours sit beside the number, never inside it , and beside it they count: Compare weighs an individual award above a team one, because nothing records a player’s share of a trophy.
The scale tilts toward attack, because that is where the evidence is.
There is no number in this panel. There is no honest one to put here.
The other 19,138 are scored on goals, assists and minutes alone, and every one of their cards says so.
Every league runs the whole way. The detail does not. A season before its league’s mark is scored on goals, assists and minutes, and the card says so rather than filling the gap.
Detail begins 2014/15 Premier League · 2015/16 every other league · 2020/21 Belgium
Penalties enter the record in 2015: a taker before then is scored without them, and nothing on his card pretends otherwise.
Not one of the 650 seasons at 85 or better was played by a centre-back. Three were played by defenders at all, and all three are full-backs.
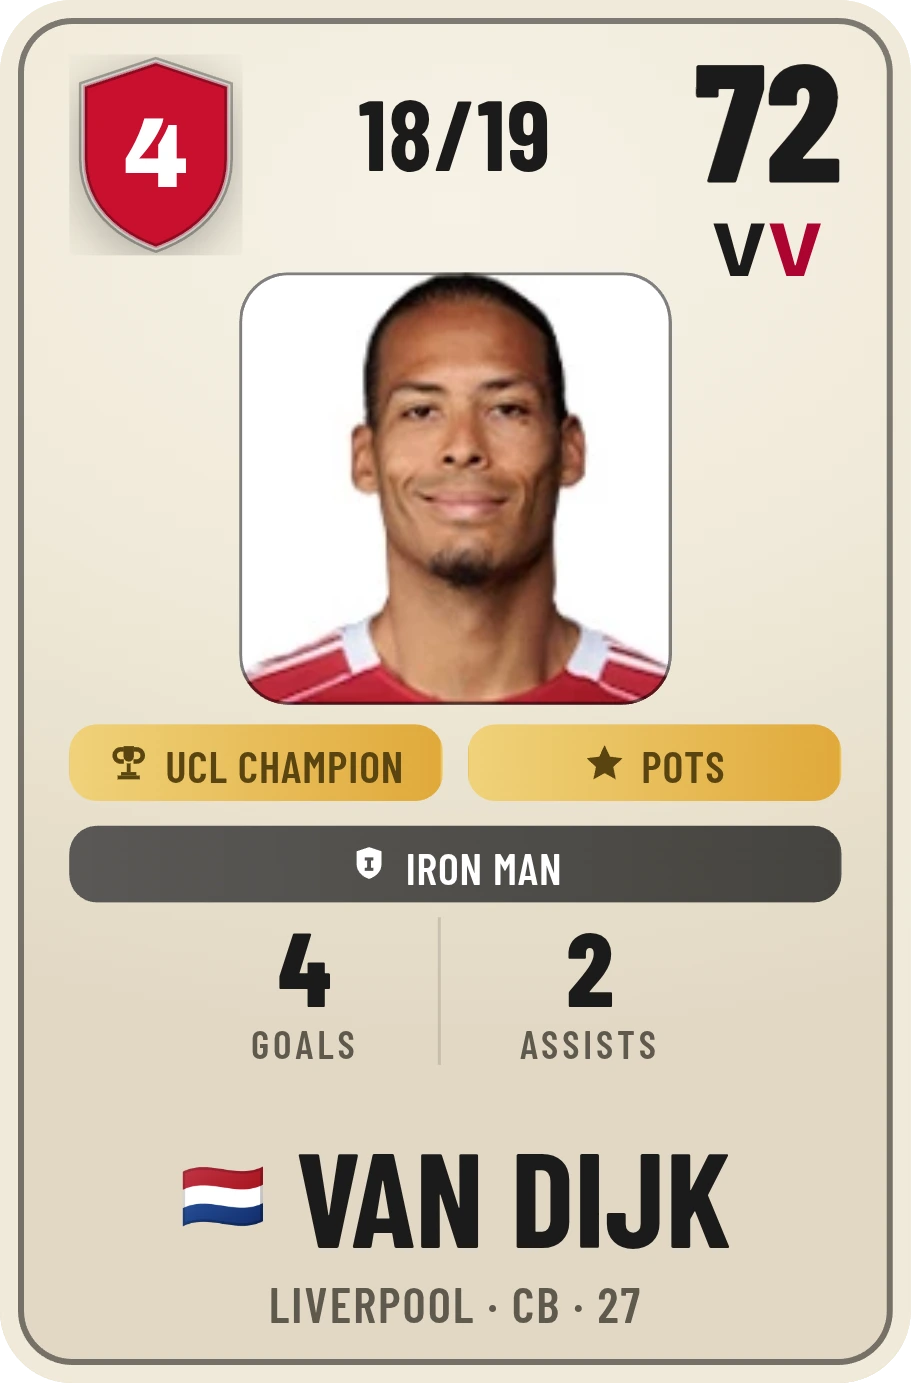
The record counts what a defender does, not what he prevents. The best defenders score below their reputation , Van Dijk sits in the low seventies , and we publish that with the reason rather than quietly moving him.
Positions are verified by hand near the top of the ladder and get coarser below.
We cannot tell you how many were checked. Nobody recorded that.
Goalkeepers are not on this scale at all.
Almost nothing a keeper does is recorded the way outfield play is.
A score is a standing, not a mark out of ten. These sit within a single point of a boundary.
Either side of a line, two seasons are closer than the labels make them look.
It rates a season, not a player. Across 4,387 players with five or more scored seasons, that is the median gap.
A rating rates a person, and a person does not have one number. Eden Hazard’s best and worst sit 64 points apart, and the dip is in the middle of his best years.
And when we change how something is scored, we publish the movement. The defensive signal was two measures blended into one number. It is one measure now: 10,770 seasons moved, not one crossed a band, and the biggest single mover was Azpilicueta’s 2018, from 70 to 72. We are telling you anyway.
What the number means
Seasons reach Generational , out of 58,066 in the record.
The band edges are fixed by rank, so that number does not drift as the record grows.
Of every pair of seasons at 80 or better, the share the Index refuses to separate. Each score carries a measured margin of error, and where two seasons fall inside it the Index says so instead of picking one.
The best seasons are bunched most tightly of all, so near the top it declines most often.
Of the 650 seasons at 85 or better were played outside the Premier League. No league has fewer than 18.
It is not a Premier League index wearing nine badges. The league a season was played in enters as a weight, not a door.
The rest of the method , what each dimension measures, how keepers are read, every tag and honour , is on the Playbook.
Now go and settle something.
Every figure here is measured rather than asserted, and every one can be checked , we would rather you did. Found a season that reads oddly, or want to ask something? Tell us.